GSE117403 / GSE141445
Human Prostate Cancer Atlas
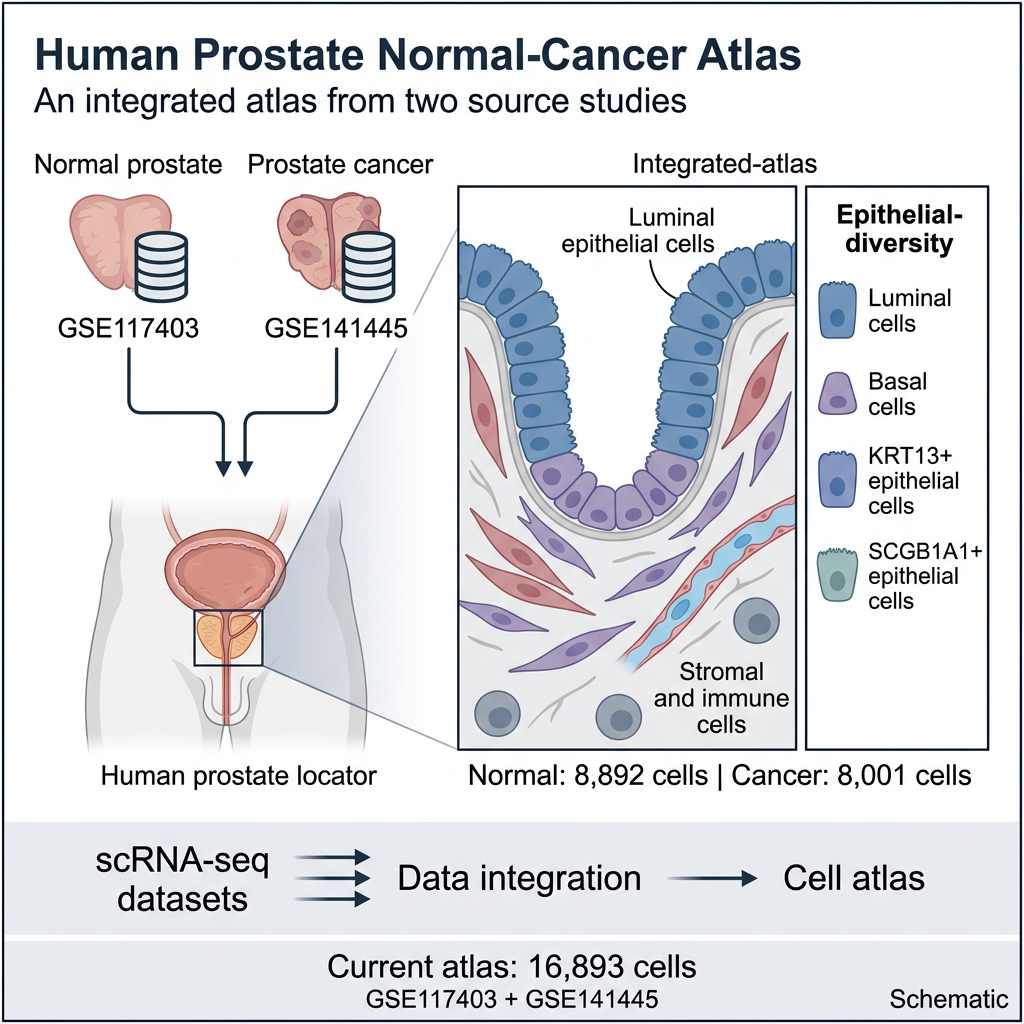
This atlas combines normal prostate and prostate tumor single-cell data from GSE117403 and GSE141445. It includes luminal, basal, specialized epithelial, stromal and immune…
Atlas schematic preview
Click to enlargeDataset Description
This atlas combines normal prostate and prostate tumor single-cell data from GSE117403 and GSE141445. It includes luminal, basal, specialized epithelial, stromal and immune populations. Comparisons between normal and tumor groups should account for their different source studies and sampling designs.
Three normal source groups and thirteen tumor source suffixes, totaling sixteen source groups. These are not necessarily independent donors. The atlas contains 8,892 Normal and 8,001 PC cells.
Data Structure
- Available embeddings
- X_umap, X_tsne
- Default coloring
- cell_type
- Cell metadata fields
- 3
- Cell metadata fields
- disease, cell_type, cell_type2
Data Statistics
16Source groups
16,893Cells
33,694Genes
11Cell types
Associated Publication
Data Preview
Five deterministically sampled cells are shown for a quick structural check.
| Row | Cell ID | UMAP 1 | UMAP 2 | Cell group |
|---|---|---|---|---|
| 1 | CTTACCGAGTGCGTGA-4_1 | 9.028 | 6.384 | FB |
| 2 | TAGACCACATCCGTGG-2_2 | -6.194 | 3.474 | LE |
| 3 | TAAGTGCCAGGAATGC-3_3 | -3.180 | -6.830 | KRT13+OE |
| 4 | AGCGTCGTCTAACTCT.11 | -6.375 | 0.859 | LE |
| 5 | ACTGTCCTCCGTAGTA.8 | -3.722 | -1.054 | SCGB1A1+OE |