GSE182786
Human Testis Aging Atlas
This atlas compares young and older human testes in GSE182786 and retains BMI-associated subgroups among older donors. The source study examined cell-type-specific aging patterns…
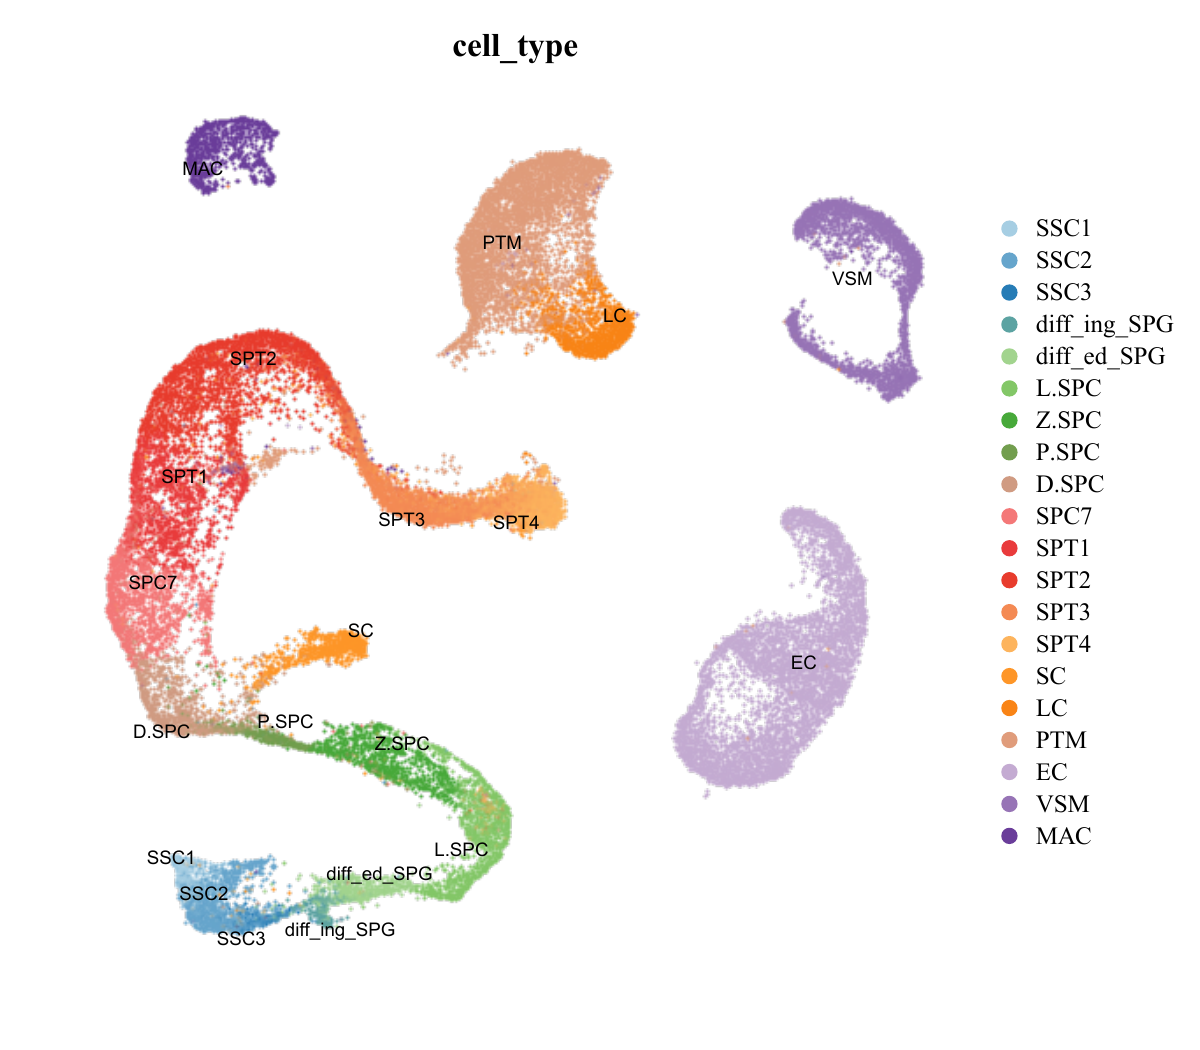
UMAP preview
Click to enlargeDataset Description
This atlas compares young and older human testes in GSE182786 and retains BMI-associated subgroups among older donors. The source study examined cell-type-specific aging patterns and their association with elevated body mass index.
Four young, five LowBMI_Old and three HighBMI_Old donors, with 12,427, 18,928 and 10,680 cells respectively.
Data Structure
- Available embeddings
- X_umap, X_tsne
- Default coloring
- cell_type
- Cell metadata fields
- 5
- Cell metadata fields
- age, age2, cell_type, cell_type2, cell_type3
Data Statistics
12Samples
42,035Cells
36,601Genes
20Cell types
Associated Publication
Data Preview
Five deterministically sampled cells are shown for a quick structural check.
| Row | Cell ID | UMAP 1 | UMAP 2 | Cell group |
|---|---|---|---|---|
| 1 | Young1.AAACCCAGTCATCCCT.1 | -10.735 | -3.492 | SPC7 |
| 2 | Young4.GCCATGGCAGTTAAAG.1 | -6.164 | -14.286 | SSC2 |
| 3 | Older4.GATCAGTAGCCGGAAT.1 | -9.198 | 4.079 | SPT2 |
| 4 | Older6.GATCAGTAGCATGATA.1 | -6.659 | 5.714 | SPT2 |
| 5 | Older8.TTTGTTGGTATGGAAT.1 | 11.713 | 9.807 | VSM |